It sometimes feels like I’m trying to swim in an avalanche, in constant danger of drowning in the sea of innovations which keep the good people at Google in work. Black Friday Structured Snippets, Customer Match Remarketing, Customisable Ads, Analytics Calculated Metrics, Shopping Ads on YouTube…
All of which can easily distract your hardworking PPC Account Manager from the basics. Split testing text ads has been a staple of my monthly workload for years, steadfast, unchanging. But I’ve never been entirely happy with the standard split-testing process. I think I’ve found a way of supplementing A/B testing to obtain more detailed information on what aspects of text ads customers respond well to.
The Problem
The standard method of split testing is to set up twin ads in each ad group, with one element differing between the two. Every month or two, we check if there’s a statistically significant performance difference, and if there is, we pause the loser, and create a new ad with one element changed. As the months roll into years, the better elements will survive, and our ad offering as a whole will evolve towards perfection.
I have a few problems with this:
- If ad groups largely contain long tail, low impression keywords, we may never get enough data for statistically significant differences to emerge. Perhaps two-thirds of ads never get updated.
- Even at 95% significance, 1 in 20 of your decisions will be wrong, adding a random element to the evolutionary process.
- In a mature account, the requirement to spend 50% of your ad budget testing out new ideas leads to successful ad elements being abandoned in favour of less effective, but innovative text.
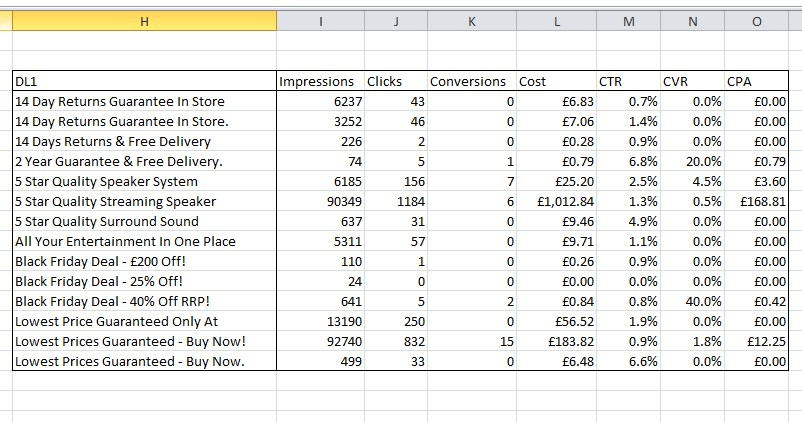
We can always use pivot tables to can try and make decisions about the ad content at a campaign or account level. The results look like this:
So what conclusions can be drawn? ‘2 Year Guarantee & Free Delivery.’ Is performing pretty well, let’s roll that out in a few more ads? But look at ‘14 Day Returns Guarantee In Store’ – it seems that we have some pernickety customers out there, since leaving off the full stop is associated with a halving of the click-through rate.
Alternatively, the two variants could be performing differently because one of them displays for better quality keywords. Indeed, that turns out to be the case for our star performer: ‘2 Year Guarantee & Free Delivery’ has good numbers because it’s showing for one of this clients most popular products. So all the pivot table is really telling us is which ads are being shown for high-performing keywords!
Finally, how can we go about testing the performance of ‘lowest price(s) guaranteed’ when there are three different variants of this in DL1 alone, each with markedly difference numbers?
The Solution
It’s =FIND().
Sorry if you were expecting more.
It’s not FIND on it’s own though. To work out if a particular element is performing well, we need to compare like with like. So how do ads containing ‘lowest price’ perform compared to ads which are in the same ad group, but don’t contain ‘lowest price’? It’s a little fiddly, but you don’t need to be an Excel ubergeek.
- Download an Ad Report and remove non-Search campaigns, and all columns except Ad, DL 1, DL2, Campaign, Ad group, Impressions, Clicks, and Conversions.
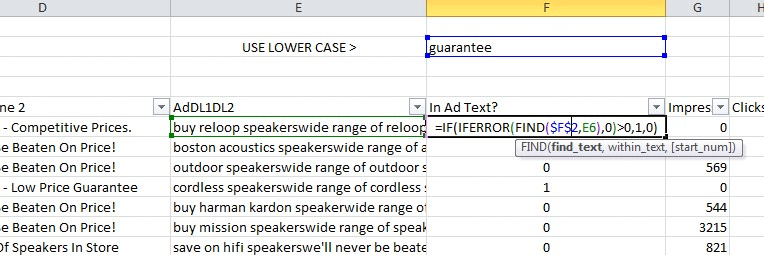
- Concatenate the Ad Headline, DL1 and DL2 into one, lowercase string, using =LOWER(…&…&…)
- Identify which ads contain the element you’re investigating, using =IF(IFERROR(FIND(… , …),0)>0,1,0) which, in this example returns a 1 if the ad contains ‘guarantee’ and a 0 if it doesn’t.
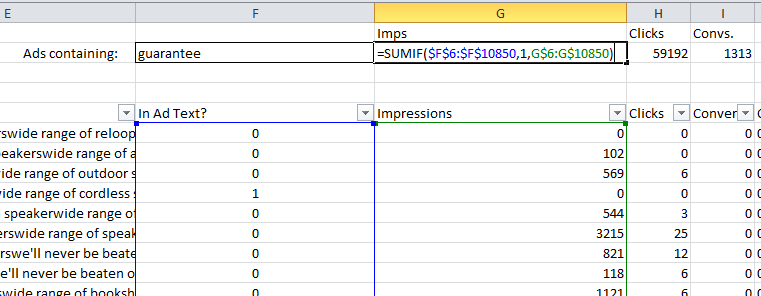
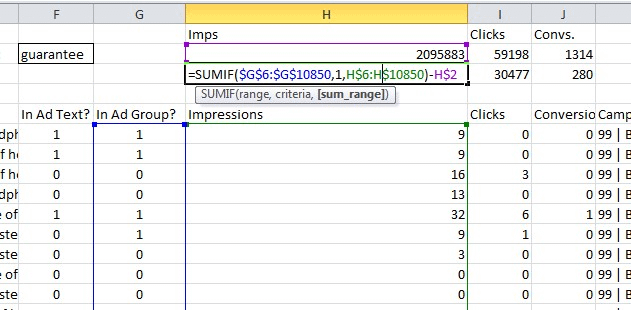
- Sum together the Impressions, Clicks, and Conversions numbers for all ads containing the relevant text, using =SUMIF( …, 1 , …)
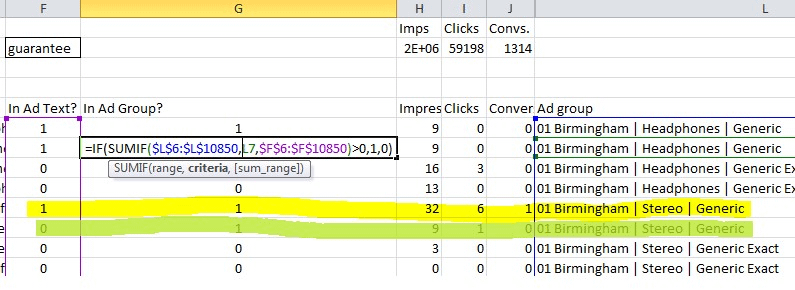
- Identify which ads don’t contain the element, but are in the same ad group as those which do. Use =IF(SUMIF( … , … , … )>0,1,0) to return a 1 if any ad in the ad group contains ‘guarantee’).
Nearly there. We’ve found the magic numbers we’re looking for – the yellow ad contains ‘guarantee’, but its green twin doesn’t.
- Use =SUMIF( …, 1, …) to add up the Impressions, Clicks and Conversions numbers for all ads which have a 1 in the ‘In Ad Group?’ column. Then remove those which have a 1 in the ‘In Ad Text?’ column, which handily you’ve already calculated in stage 4.
- Get testing! Calculate your clickthrough and conversion rates, and start looking for words and phrases which perform well above or below expectations. You should probably put in some significance testing at this point, but I feel, dear reader, that you’ve suffered through enough formulas for now. Let’s skip to the results.
Ads containing ‘guarantee’ convert at double the rate of ads that don’t, for exactly the same keywords.
A few more. ‘low prices’ gets a thumbs down:
But ’14 day returns’ is a hit.
I could go on like this all day.
Finally though, a couple of words of warning. Testing the performance of, say, ‘free’ could return only a meaningless combination of data from ads with ‘free delivery’ and others with ‘risk free’ (and indeed, ads with ‘freezer’, ‘freehold’, etc.) Also, ad text is not randomly distributed between ad groups. A particular piece of copy might test well, but only because, in a lot of ad groups, it’s running against ads which are bloody awful.
Better than nothing though, eh?

